
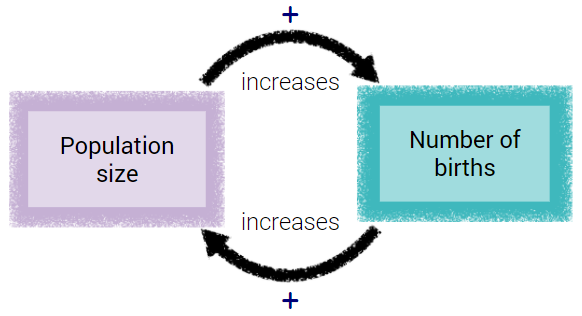
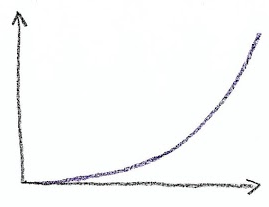
Introduction to causal maps
With these handouts and worksheets, students can be introduced to causal mapping to analyze causal relationships in complex systems.
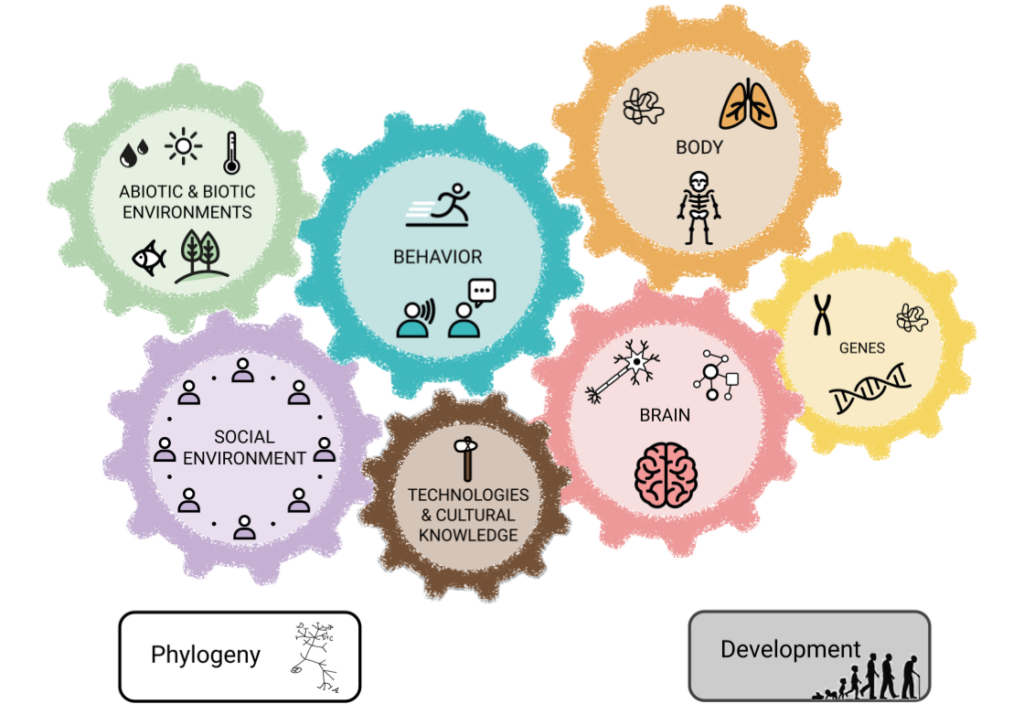
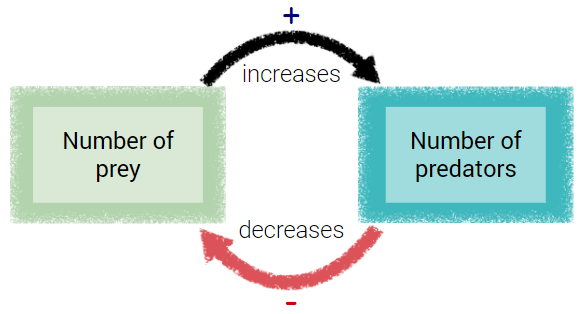
Causal domain graphics
Graphics for causal mapping


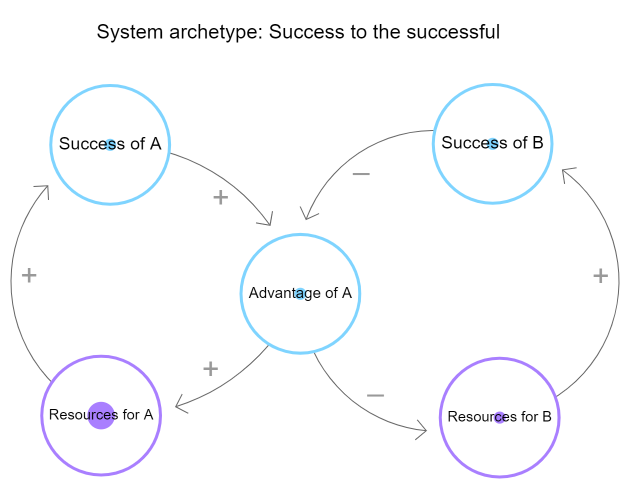
System archetypes
A collection of causal maps for system archetypes, made with Loopy

Connecting Past, Present, and Future
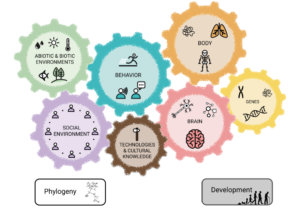
A collection of materials for connecting past human evolution to the present and the future. Students explore global trends and relationships between human behavior, technologies, social organization, environment, and well-being.
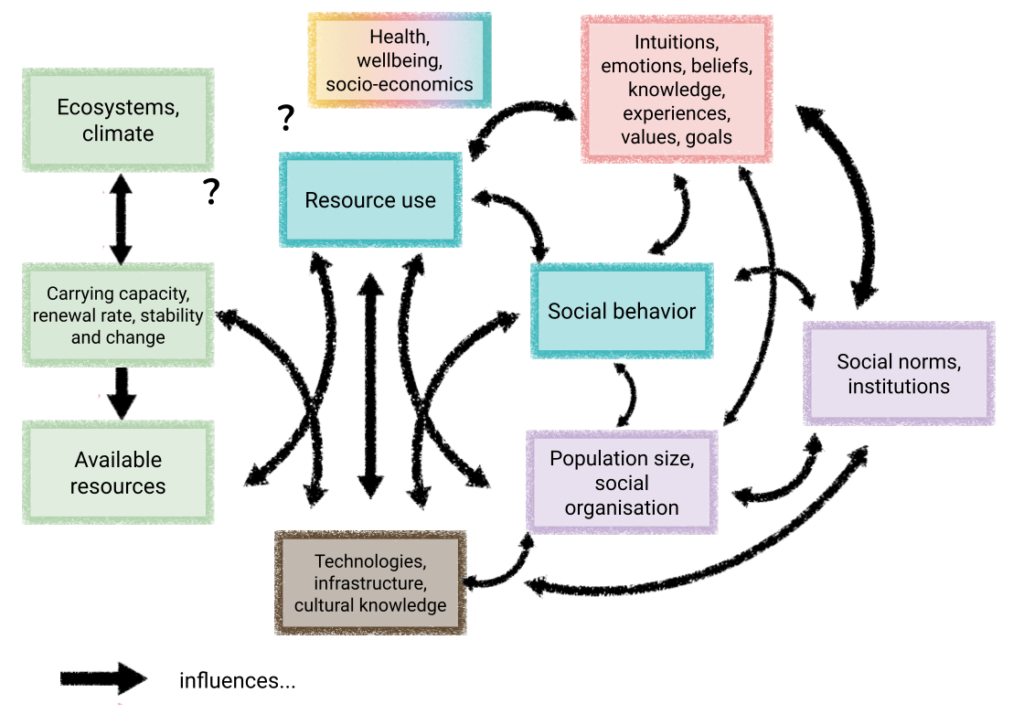
Causal mapping pieces for causal relationships in the present and future
Materials for creating a causal map on the relationships between human behaviors, technologies, institutions, social and natural environments
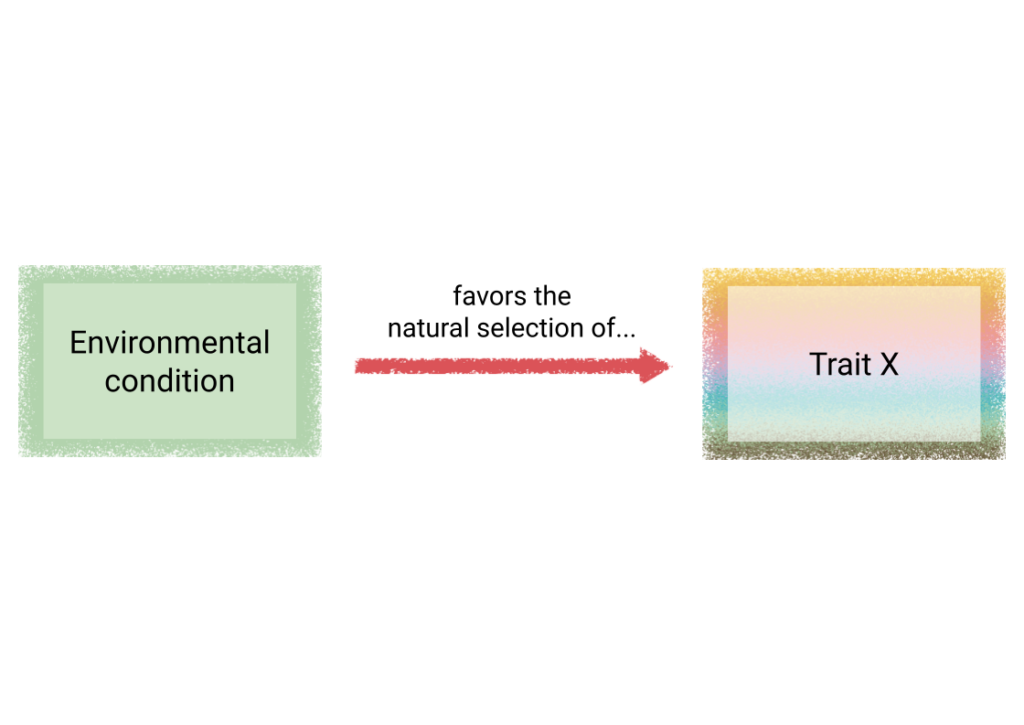
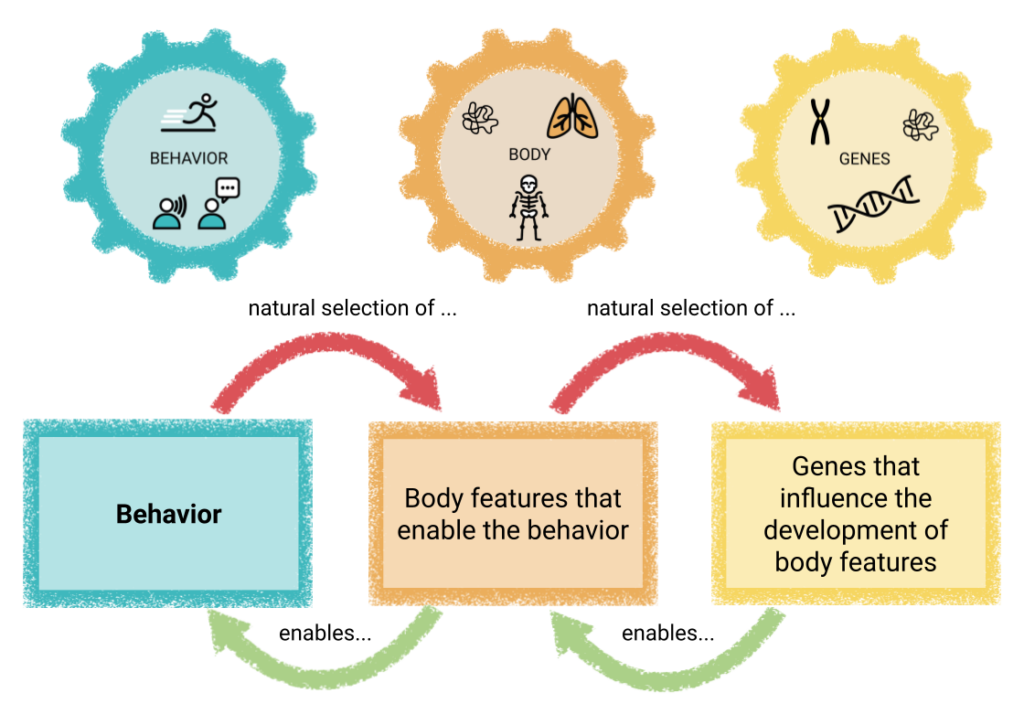
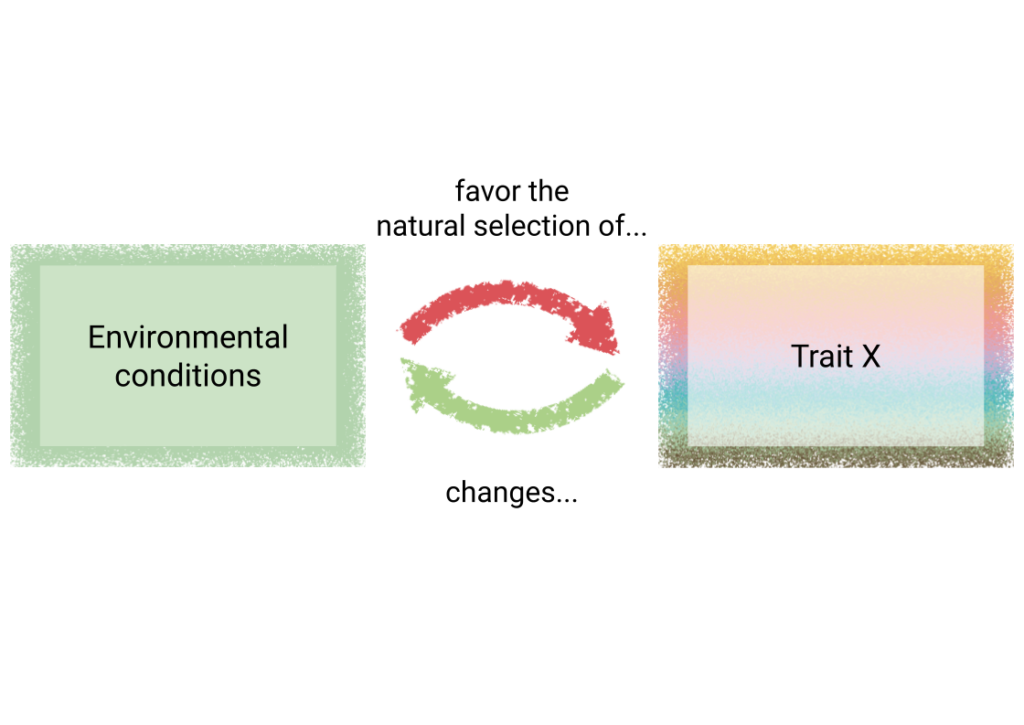
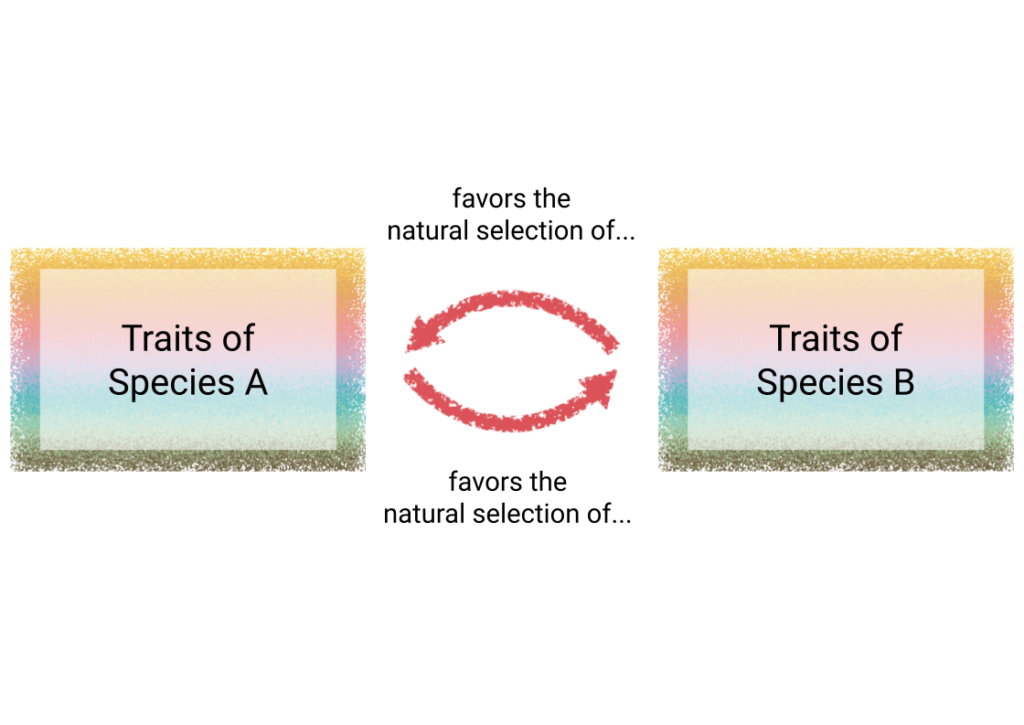
Causal maps on the evolution of human traits
All causal maps on human evolution in one Google slide file
Blackboard materials: Causal maps on human evolution
Materials for constructing causal maps about the evolution of human traits on the blackboard
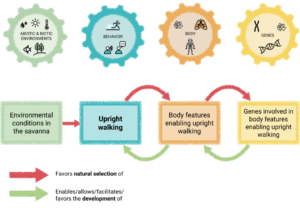
Handout: Introduction to causal maps with the example of upright walking
A handout that introduces students to the causal map to map the evolution and development of traits, with the example of upright walking