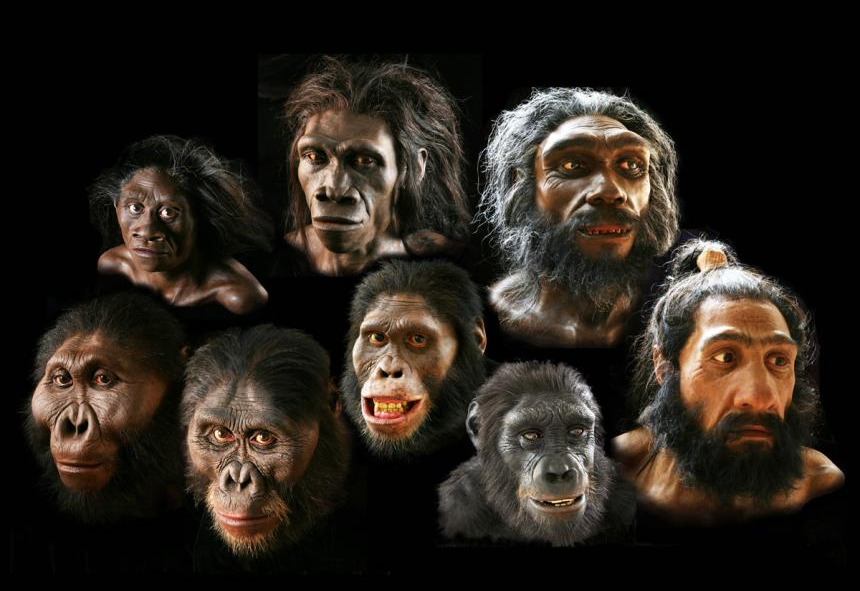
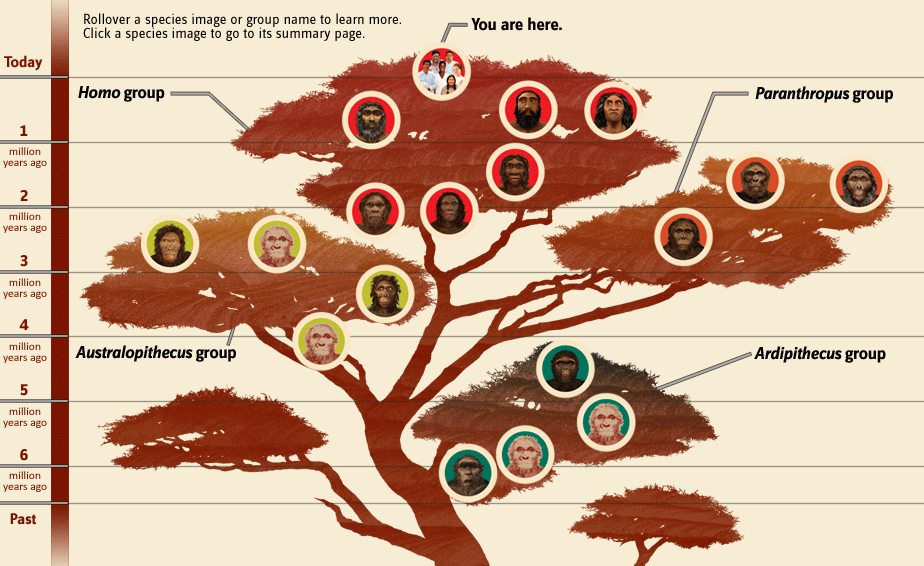
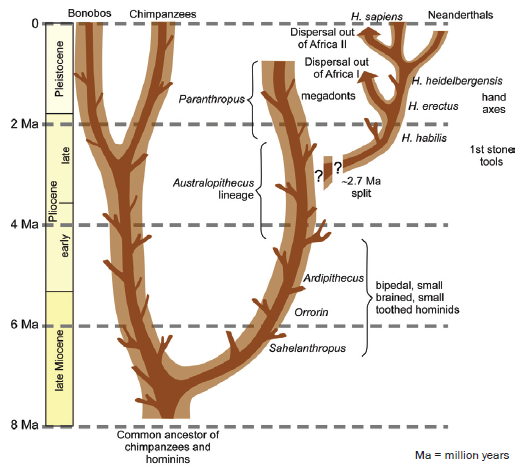


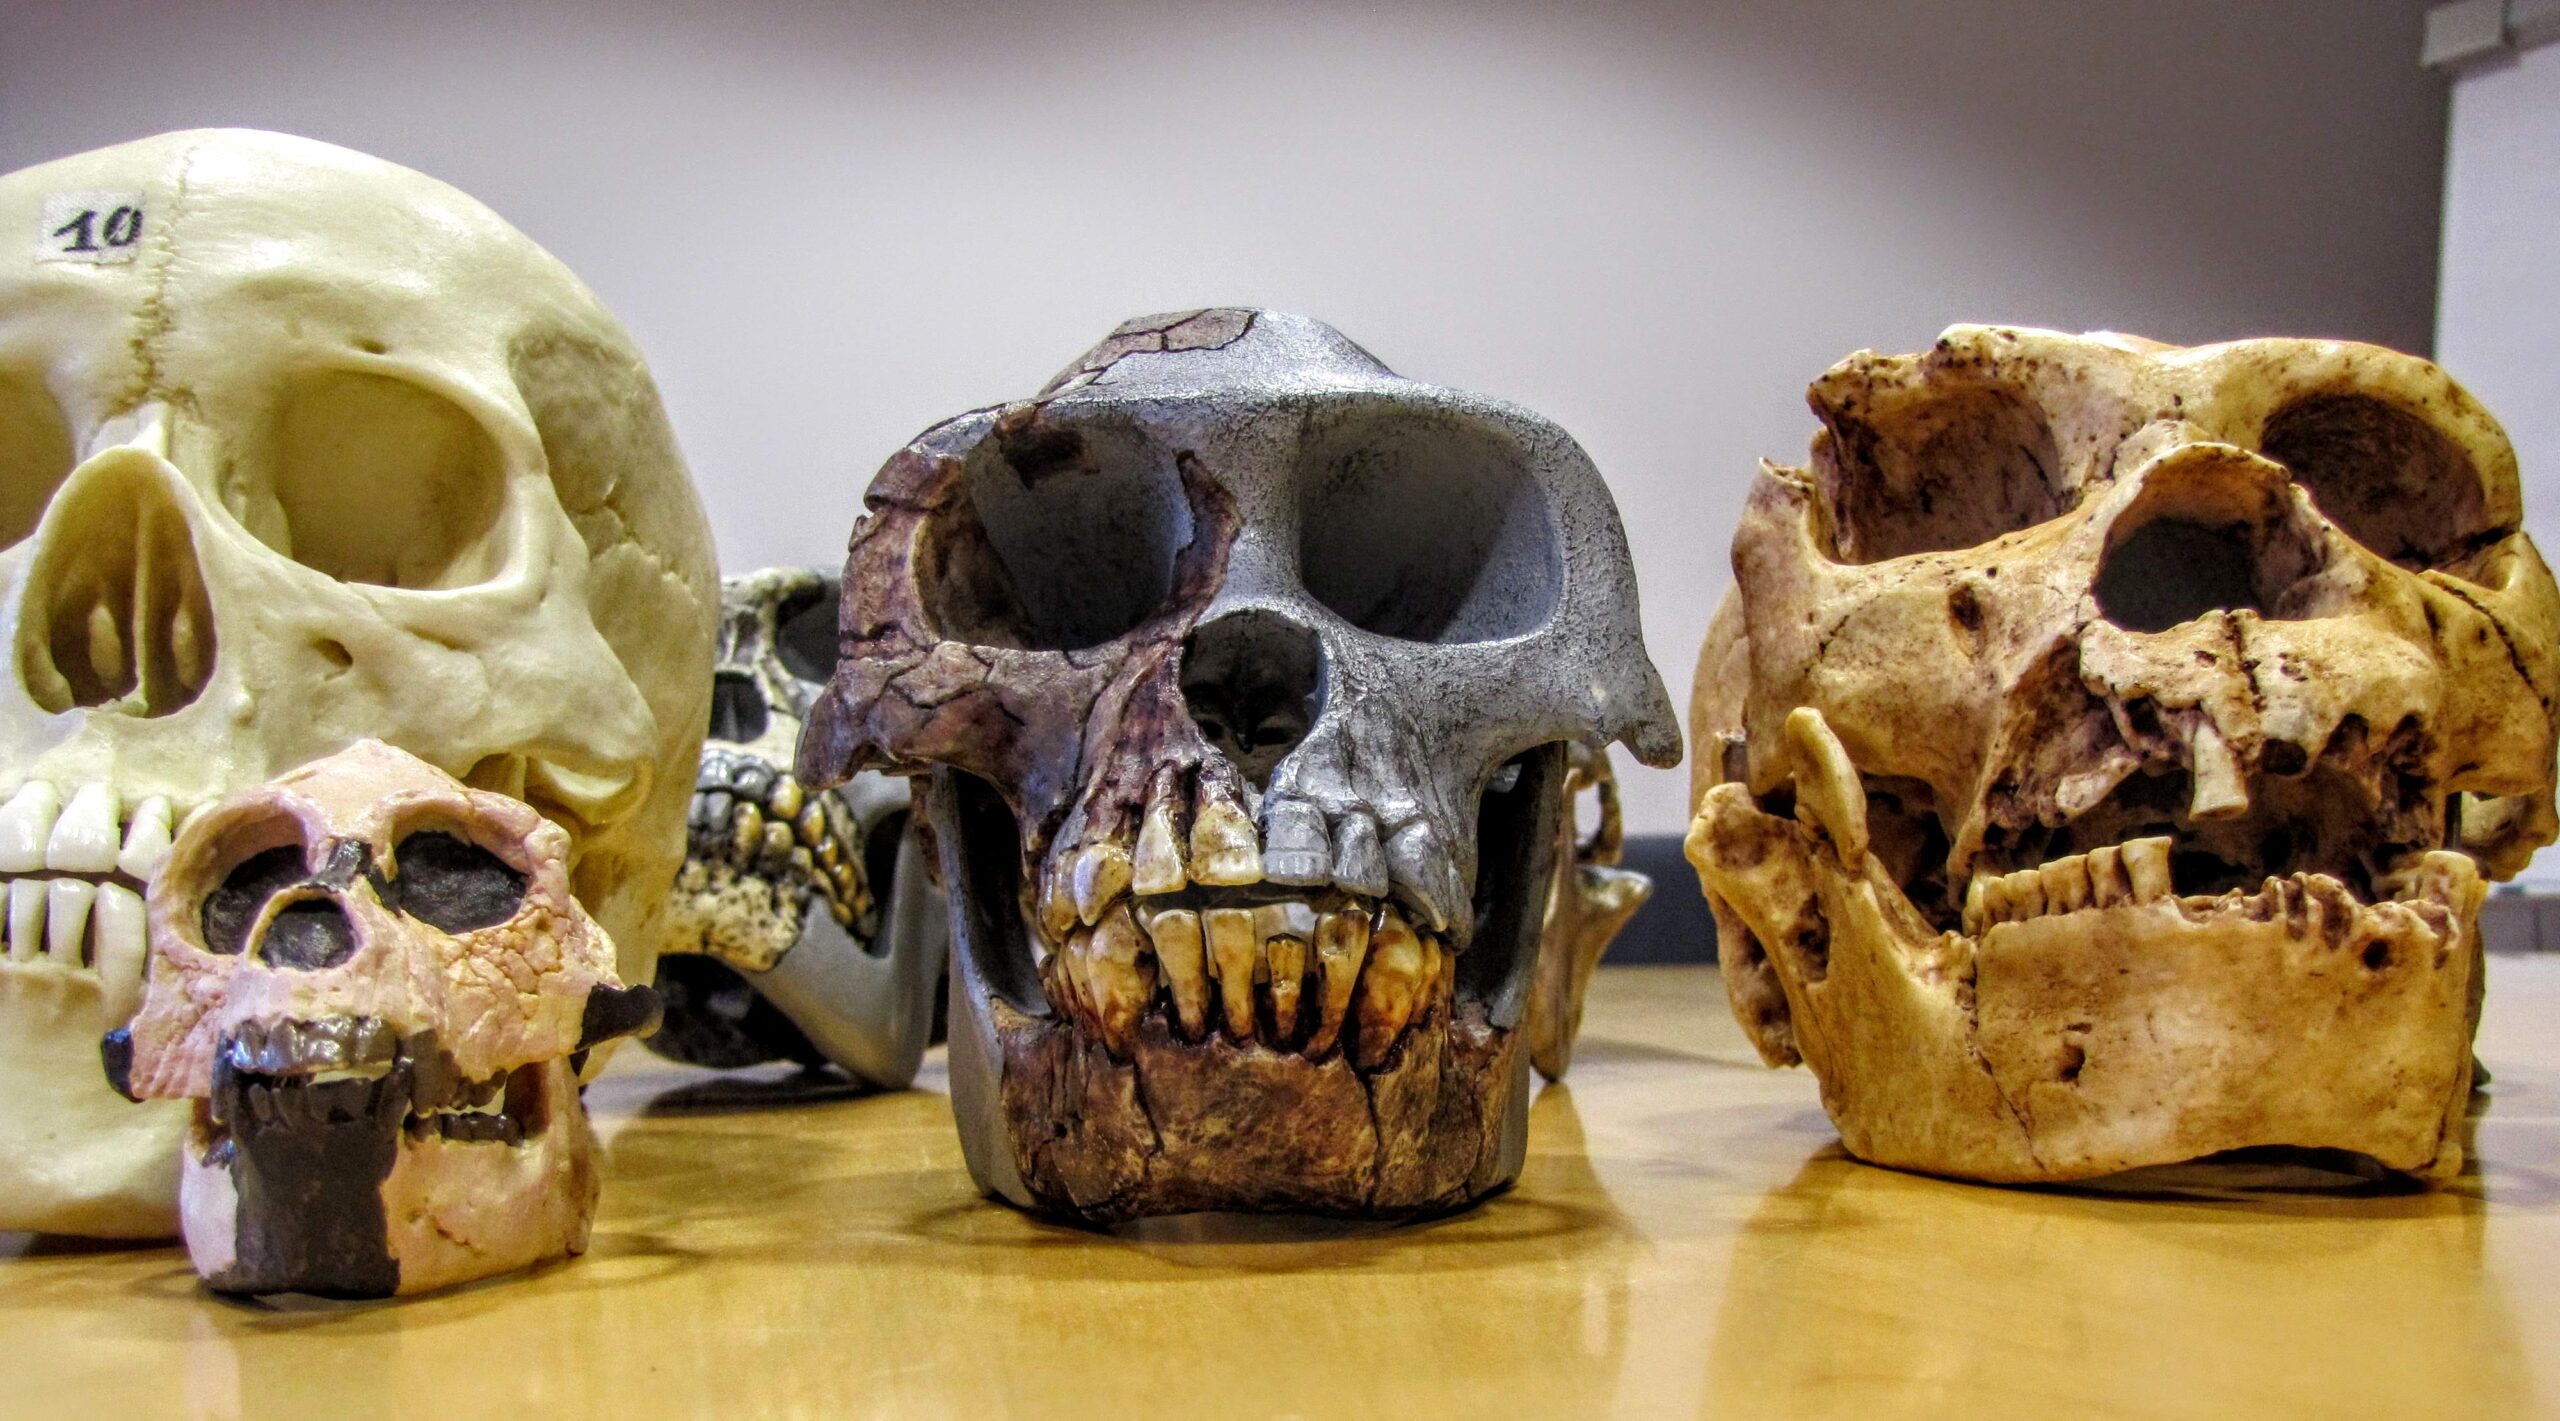
Observing differences in hominin skulls
An activity for students to explore and notice traits on fossil hominin skulls
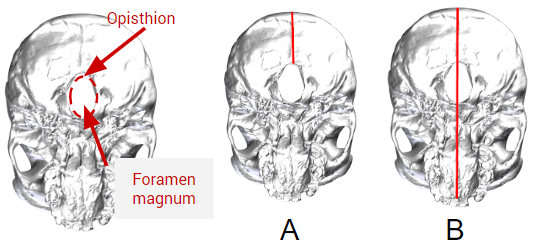
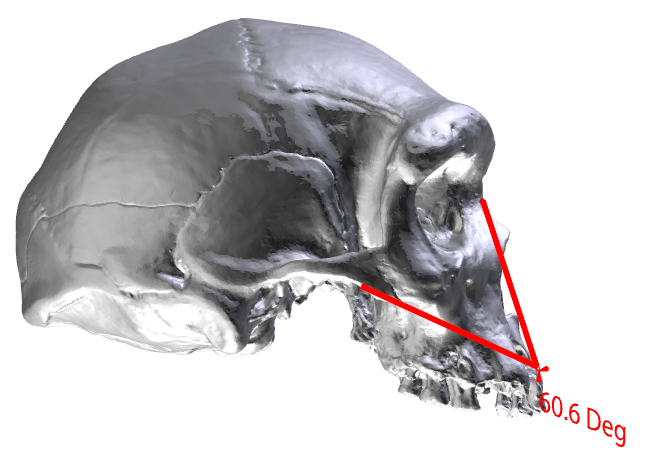
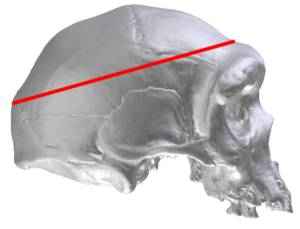
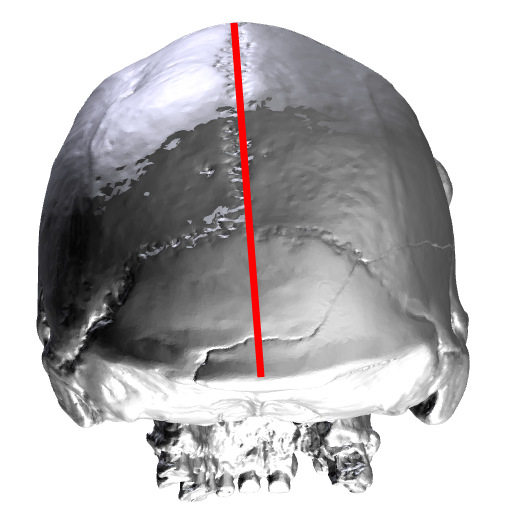
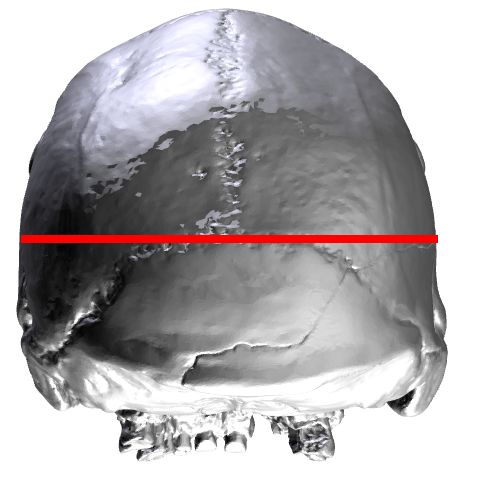
Hominin skull measurement instructions
Instruction sheet for measuring cranial capacity, opisthion index and prognathism on fossil hominin skulls
Hominin skull measurement Google sheet for data entry and analysis
Google sheet template for entering and plotting the measurements of hominin fossil skulls
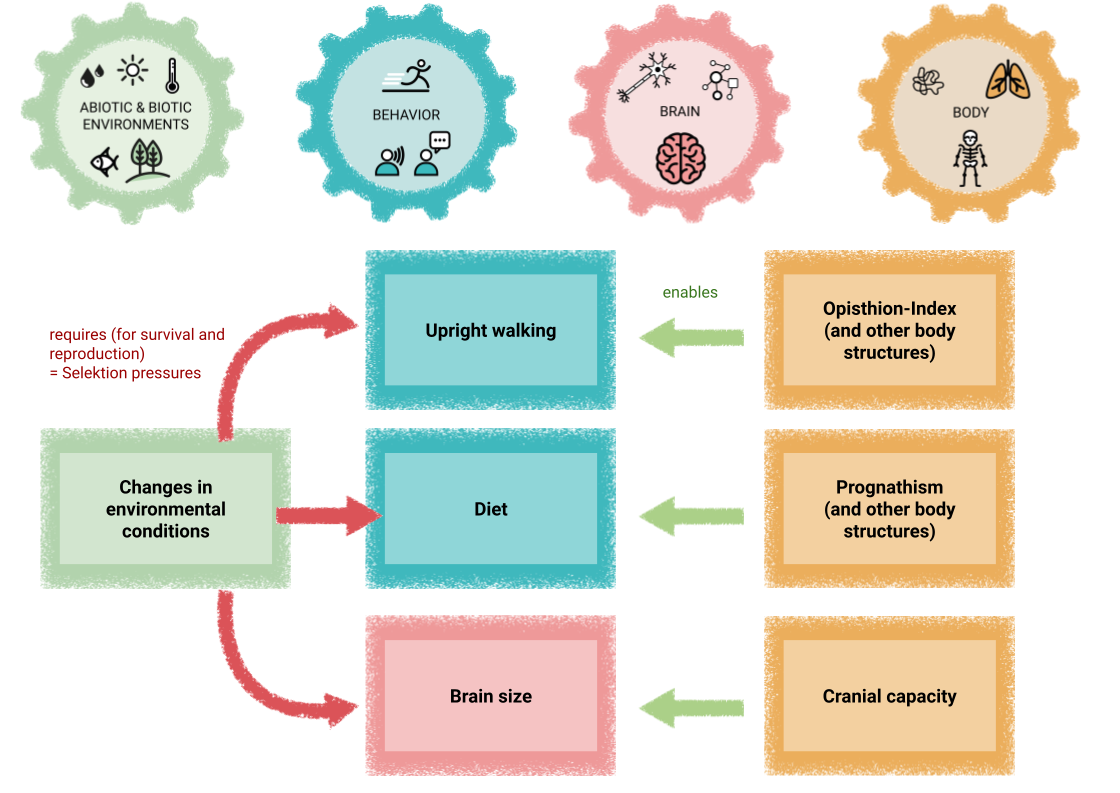
Causal map materials for skull morphology and related traits
Materials for constructing an initial causal map relating observable features of fossil hominin skulls, behaviors, and environmental conditions